Introduction
Background
Data Center Characterization
LLM vs. Prior DL Workloads
Shorter Job Duration
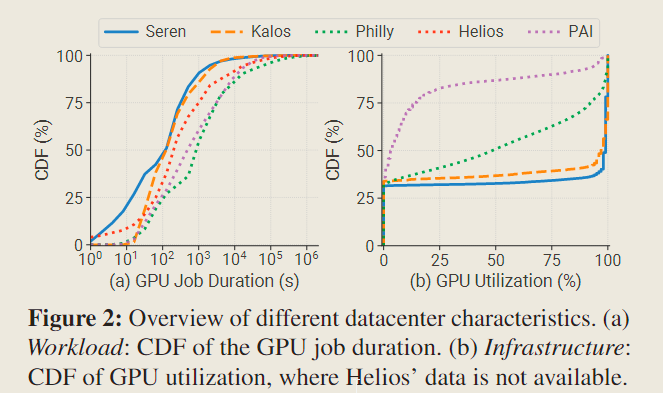
As shown in Figure 2 (a), contrary to the prevailing stereotype that LLM-related jobs are typically long-running, we find the workloads in our clusters (blue and orange lines) exhibit shorter GPU job durations (i.e., job runtime, excluding queuing delay) compared to the DL workloads observed in previous job traces (dotted lines).
To provide an explanation for this observation, we outline four potential factors:
- Hardware upgrade. The iteration of GPU and networking delivers substantial efficiency improvement.
- Abundant resources. Users usually request more resources (as shown in Table 2), averaging 5.7 GPUs in the Seren and 26.8 GPUs in the Kalos. This can significantly accelerate the training process.
- Extensive associated workloads: LLM development pipeline involves numerous small-scale associated jobs, such as evaluation. We will delve into this in §3.2.
- High incompletion rate: Approximately 40% of jobs fail, with completed jobs consuming only 20∼30% of GPU resources.
This highlights the urgent need for a fault-tolerant system.
Polarized GPU Utilization
GPU utilization in our two clusters exhibits a polarized pattern, primarily concentrated in two distinct states: 0% and 100%.
This polarization mainly stems from the fact that the workloads in our clusters share similar model architectures, i.e., transformer-based LLMs. In contrast, Philly and PAI encompass a broader range of utilization.
Besides, when comparing the median GPU utilization, Seren and Kalosexhibit significantly higher values at 97% and 99%, respectively.
This observation aligns with the common understanding that LLMs are computationally intensive.
It also implies that GPUsharing-based scheduling techniques [40, 98, 99, 106] may not be suitable for LLM development.
High-skewed Workload Distribution
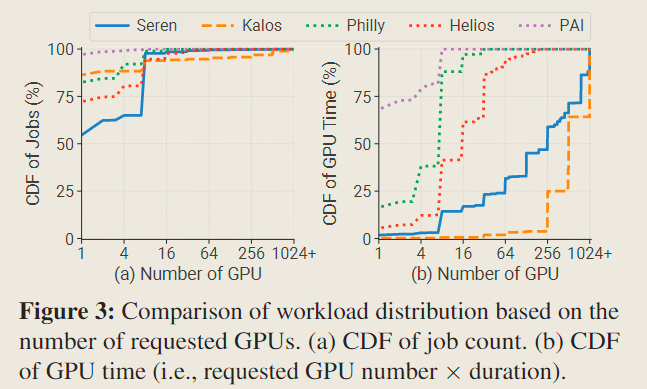
For the number of jobs, all the clusters share a similar pattern in that the majority of jobs are single-GPU jobs and less than 7% of jobs request over 8 GPUs.
However, when examining GPU time, singleGPU jobs only account for less than 2% resources in our two clusters, while taking over 68% GPU time in PAI. In stark contrast, large-scale jobs (≥ 256 GPUs) dominated the GPU time in Kalos, occupying more than 96% of resources.
The much steeper distribution poses substantial challenges for the design of cluster schedulers. A majority of resources are allocated to a few pretraining jobs, potentially causing head-of-line blocking issue and resulting in severe queuing delay.
Existing DL cluster schedulers typically depend on preemption mechanism, however, the considerable recovery overhead makes them not applicable to LLM workloads.
This highlights the critical need for a scheduling system tailored for LLM clusters, considering the workload features of the entire pipeline.
Workload Categories
考察不同类别的工作负载对资源占用、资源需求、时间占用的情况。
作业数量与资源占用间的无关性
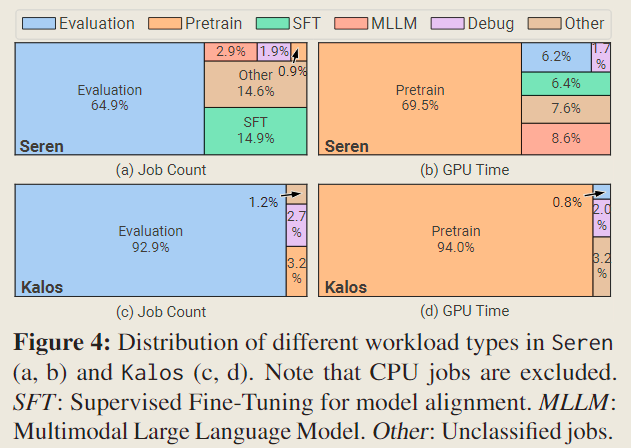
It is obvious that evaluation jobs constitute the majority of the total job count in both clusters, yet they consume a relatively small portion of resources (0.8% in Kalos). In contrast, pretraining jobs only account for 0.9% and 3.2% of the total job count but consume 69.5% and 94.0% of the total GPU time in Seren and Kalos respectively.
作业类型与 GPU 需求间的相关性
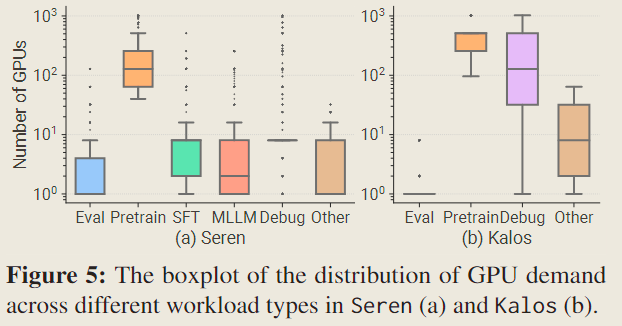
Both whiskers are defined at 1.5× the InterQuartile Range (IQR). Compared to evaluation jobs, which typically require less than 4 GPUs, pretraining jobs often require over 100 GPUs. This observation partially explains why evaluation jobs in Kalos consume only minimal resources in Figure 4 (d).
Debugging jobs have a wide range of GPU requests, which aligns with the fact that testing jobs are typically needed for various types of tasks.
相似的时间分布
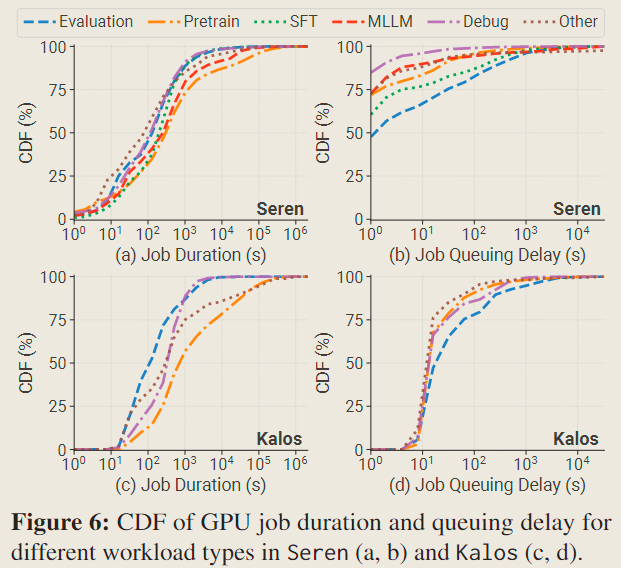
In terms of job duration, although pretraining jobs have the longest duration, they surpass other workloads within an order of magnitude in the median, and less than 5% jobs last for over 1 day in both clusters.
Regarding job queuing delay, contrary to previous reports [38, 45, 97] suggesting that larger-scale jobs experience longer wait times, we observe that evaluation jobs have the longest queuing delay despite having the lowest GPU demands and shortest job duration. Evaluation jobs are typically submitted as a batch simultaneously with lower priority, utilizing the limited spare resources.
Infrastructure Utilization
高 GPU 利用率
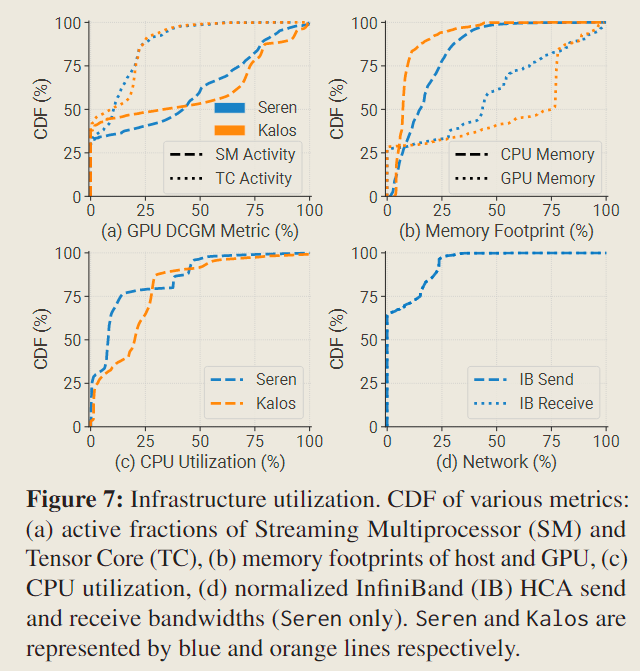
In contrast to PAI [97], where a significant portion of GPU memory is underutilized (less than 25% memory), our observations in Kalos indicate that 50% of GPUs consume over 75% of GPU memory (60 GB). Furthermore, we observe that the median SM activity in both clusters is approximately 40%, which is twice the reported 20% in PAI.
These findings align with the memory-intensive and computeintensive natures of LLMs.
其他相关资源的利用率不高
In Figure 7 (b), we compare the memory footprint on the host side and GPU side. It is evident that CPU memory utilization remains below 50%.
This demonstrates the significant underutilization of CPU memory.
Although the GPU memory offloading technique improves CPU memory utilization and alleviates GPU memory limitations, it also impedes training throughput due to limited PCIe bandwidth.
We observe that NICs remain idle for over 60% of the time, and the active bandwidth rarely surpasses 25% of the maximum bandwidth provided by IB.1
Environment Impact
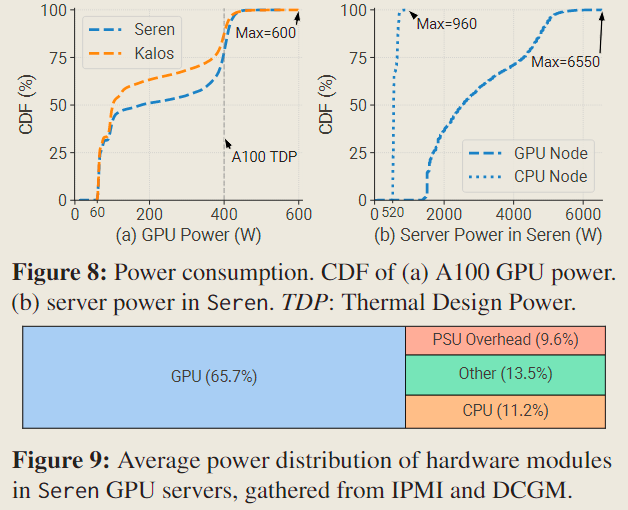
We observe that around 30% of GPUs are in an idle state and still need to consume 60 W. Besides, due to intensive computation demand, we find that 22.1% and 12.5% of GPUs consume over 400 W (TDP) in Seren and Kalos respectively, with some even reaching 600 W.
We find GPU servers consume 5×power than CPU servers on average.
Figure 9 demonstrates that GPUs account for approximately 2/3 of the total power consumption in GPU servers, while CPUs only contribute 11.2% and power supply units (PSUs) consume 9.6% of the energy during voltage conversion.
These observations align with the understanding that GPUs are the primary power consumers in LLM development.
Workload Profiling
细粒度地考察代表性任务的资源利用情况,分别是资源密集型任务 pretraining jobs 和数量密集型任务 evaluation jobs 。
Pretraining Workload
For GPU SM Utilization,
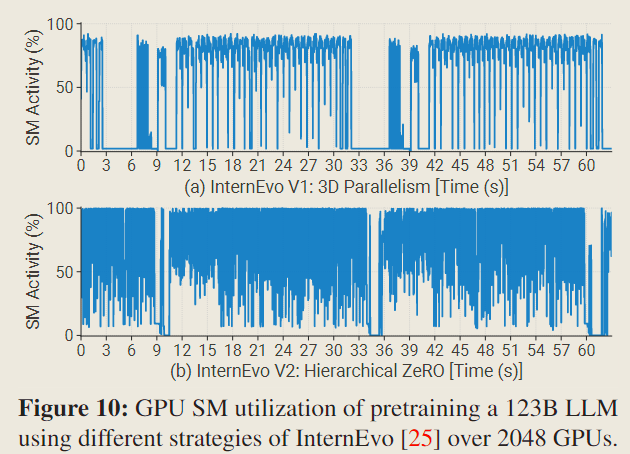
Both versions maintain the same global batch size and are optimized according to their respective configurations.
It is evident that InternEvo V2 presents superior peak SM utilization and exhibits reduced idle periods compared to InternEvo V1, achieving around 16% acceleration.
The relatively low utilization of 3 D parallelism is mainly due to the impact of communication introduced by hybrid parallelism on the critical path, such as bubbles in pipeline parallelism.
For GPU Memory Footprint,
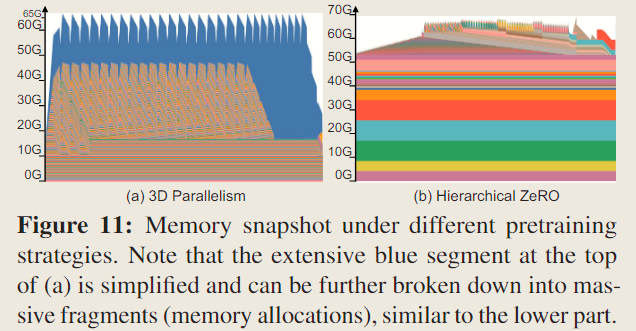
In comparison to hierarchical ZeRO, the memory requirement for activations in 3D parallelism is substantially higher.
This observation underscores the importance of efficient activation memory management as a key factor for enhancing batch size and throughput in 3 D parallelism.
For Imbalance in Activation Sizes,
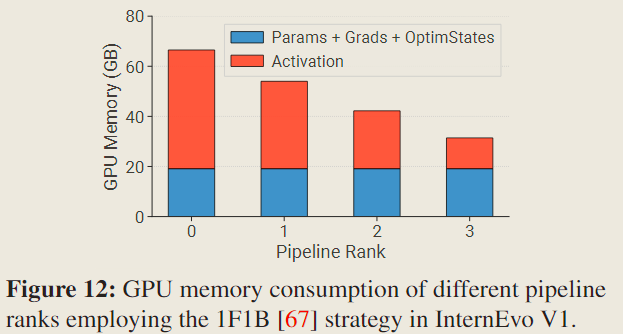
When employing pipeline parallelism, each rank needs to hold a different quantity of activations since the diverse number of micro-batches pending backward computation across various pipeline ranks.
It suggests that we should employ a specialized partitioning mechanism to address the unbalanced memory usage among different ranks in pipeline parallelism, in order to achieve higher efficiency, such as recomputing activations.
Evaluation Workload
LLM 在预训练的过程中会不断产生 checkpoint,必须在 checkpoint 产生时进行评估,才能使得 LLM 导向预期的训练目标。因此 evaluation workload 是 LLM 训练任务中数量最多的任务,它也由此产生 2 个资源利用相关的问题。
High Model Loading and Data Preprocessing Overhead
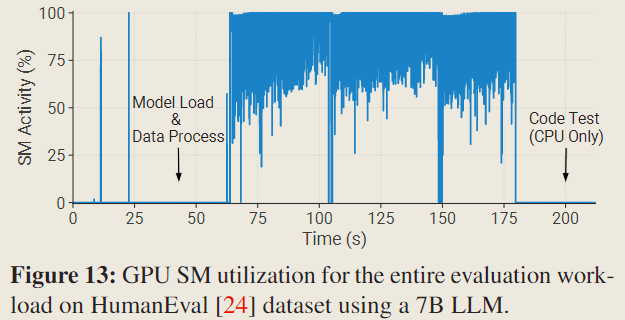
The evaluation task consumes over 1 minute prior to the actual GPU inference, accounting for 29.5% of the evaluation duration.
To address the preprocessing overhead, one effective strategy is to cache the tokenized data. Moreover, evaluation jobs are flexible, allowing for the consolidation of multiple evaluation tasks (datasets) into a single job. This consolidation can effectively reduce the relative time overhead of the model loading phase within the evaluation process.
High Metric Computation Overhead
The evaluation process can often involve complex and time-consuming metric computation. For example, synthesized program correctness tests need to be performed on coding datasets like HumanEval [24] and MBPP [17]. Moreover, the OpenAI GPT-4 API is invoked to assess the performance of model conversations (e.g., Chatbot Arena [112]). These procedures can take up to 30 minutes, during which the GPU remains idle.
Therefore, we can observe distinct stages of GPU usage, including stages that require GPU for inference and generation, and stages that do not require GPU for metric computation and verification.
Failure Analysis
本节通过运行时日志(runtime logs)和硬件监视数据(hardware monitor data)考察作业失败时的表现。
Failure Category
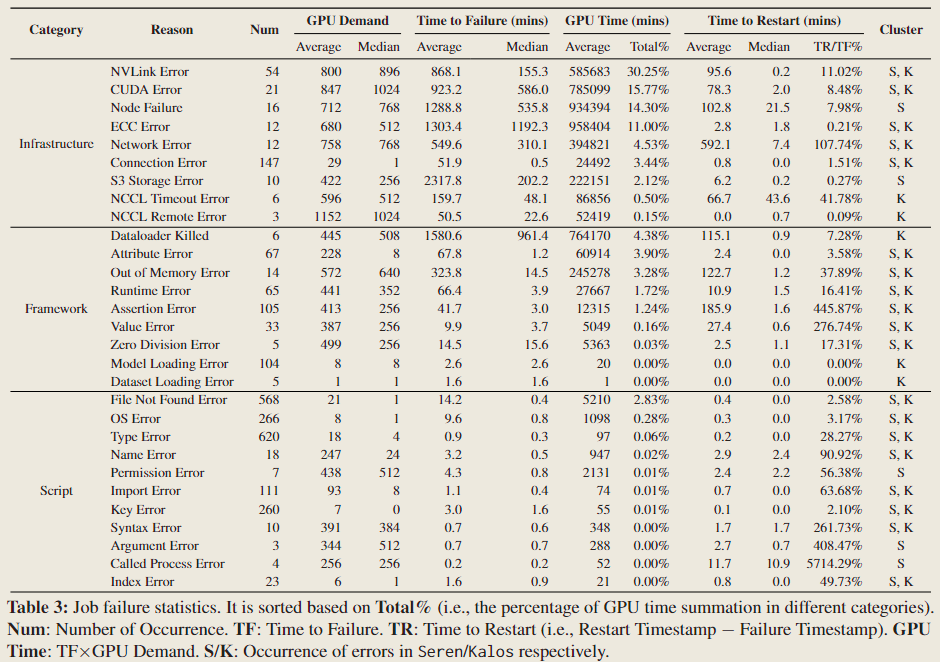
Infrastructure. These failures mainly occur midway through the job execution process, especially in pretraining tasks. They severely impact the training progress due to laborious and time-consuming recovery process.
Framework. They are often observed in the initial phases of jobs and are typically resolved by fixing the configurations.
Script. Script errors typically stem from programming errors or user oversights. They constitute the majority of failures and are often addressed by revising codes.
Failure Characterization
Infrastructure Failures Cause Most Severe Impact.
Jobs that fail because of infrastructure issues often use a substantial number of GPUs (GPU Demand) and require considerable effort to restart (Time to Restart). They take over 82% GPU resources (GPU Time) with only 11% failed job quantity (Num).
Addressing these infrastructure failures requires meticulous diagnostic efforts to pinpoint the source of the problems, often leading to the maintenance or replacement of defective hardware, which results in significant restart costs.
Failures Caused by High Temperature.
GPU overheating can cause NVLinkErroror ECCError.
This phenomenon is largely due to the highly optimized communication cost, resulting in an exceptionally low GPU idle rate.2
Many Failures Induced by Auxiliary Services.
In our pretraining framework, we connect to external components or services for metric reporting, logging, monitoring and alerting. These auxiliary services are vulnerable to network instabilities, potentially resulting in timeouts or failures that can decelerate or disrupt the training process.
Evaluation Jobs Rarely Encounter Errors.
In Kalos, only 6.7% of evaluation tasks encounter errors, and notably, there are no recorded instances of GPU or NVLink failures. The low error rate may be attributed to their short duration and the resultant decreased stress on GPUs and NVLink connections. Consequently, this diminishes the chance of hardware and operational failures that are more frequent in pretraining jobs.